What Is a Good NPS Score? Benchmarks by Industry
What a good NPS score is, how NPS is calculated, why industry benchmarks disagree, and how to collect and track NPS on phone calls.
A good Net Promoter Score (NPS) is any score above 0, and most teams treat 50 or higher as excellent. NPS runs from -100 to +100, so a score is "good" only relative to the same measurement elsewhere: your own previous quarters first, then competitors in your industry surveyed the same way.
This guide gives the tiers, a benchmark table built from two published datasets that do not agree, and a way to measure NPS from phone calls with Retell AI. For the full background on the metric, see our guide to Net Promoter Score.
How is NPS calculated?
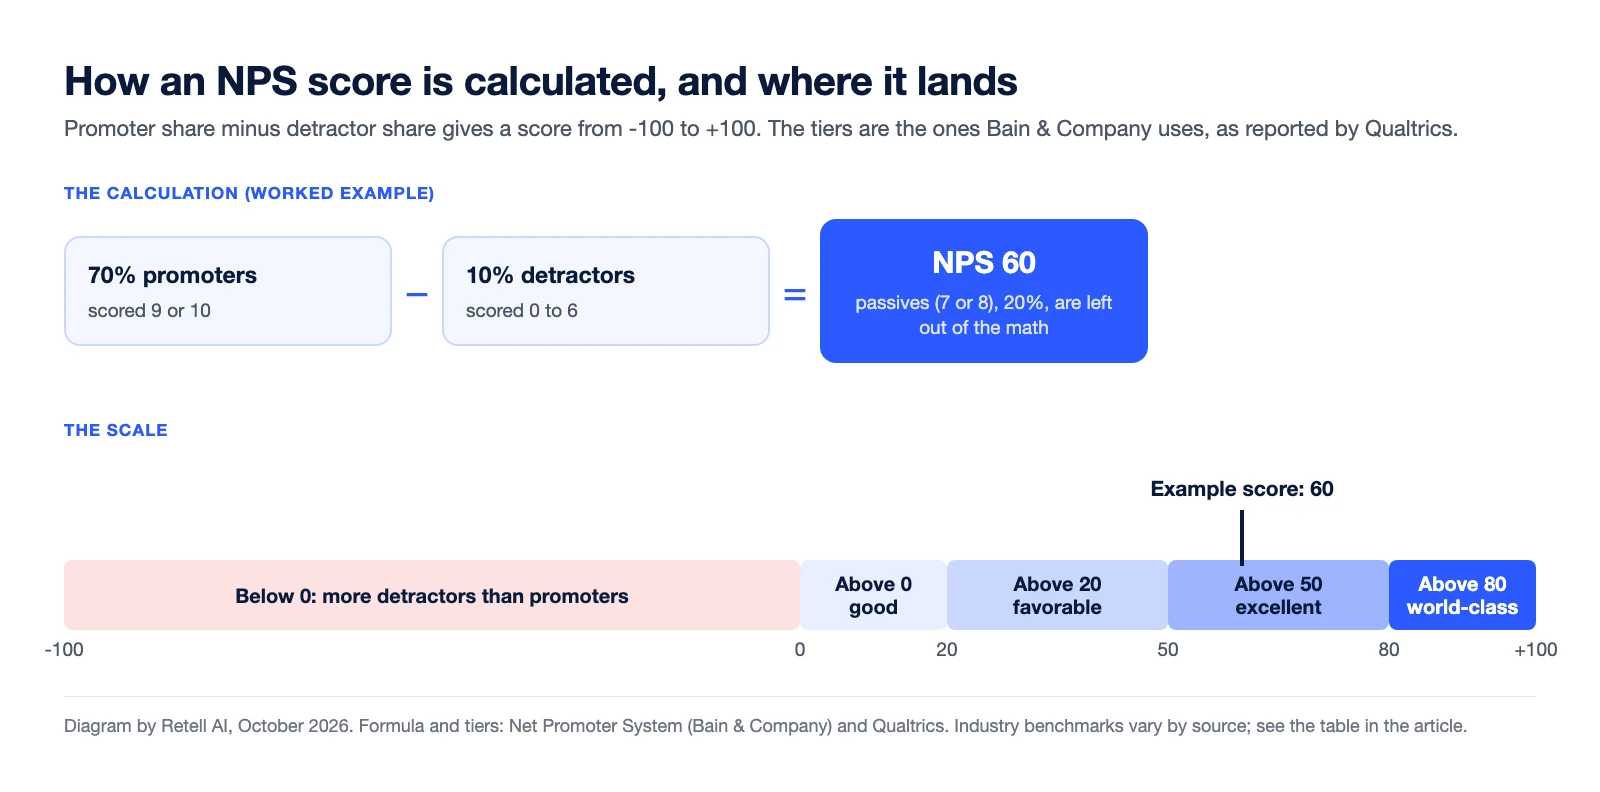
NPS is the percentage of promoters minus the percentage of detractors. Customers answer one question, how likely they are to recommend you to a friend or colleague, on a zero-to-ten scale, and the Net Promoter System sorts them into three groups:
- Promoters score 9 or 10.
- Passives score 7 or 8. They count in the sample but not in the subtraction.
- Detractors score 0 to 6.
Qualtrics gives a worked example: if 70% of respondents are promoters, 20% are passives, and 10% are detractors, the score is 70 minus 10, which is 60. The result is reported as a number from -100 to +100, not a percentage (Qualtrics).
A common mistake is averaging the 0 to 10 answers. An average of 7.2 is not an NPS and hides the split between promoters and detractors that the metric exists to show.
What NPS score counts as good, great, or bad?
Above 0 is good, above 20 is favorable, above 50 is excellent, and above 80 is world-class, according to the tiers Bain & Company uses as reported by Qualtrics. Anything below 0 means detractors outnumber promoters.
| NPS | Tier | What it means |
|---|---|---|
| Below 0 | Needs work | More detractors than promoters |
| Above 0 | Good | More promoters than detractors |
| Above 20 | Favorable | A clear lead for promoters |
| Above 50 | Excellent | Strong loyalty across the base |
| Above 80 | World-class | Rare |
Source: Qualtrics, citing Bain & Company's tiers. Qualtrics itself cautions that it is "tricky to point to a single Net Promoter Score as being 'good' in absolute terms" because industry benchmarks differ.
What is a good NPS score by industry?
It depends on whose data you read. Two benchmark publishers put the same industry 24 points apart, so pick one source and stick with it.
| Industry | Survicate median, 2025 | Retently average, 2026 |
|---|---|---|
| Healthcare | 61 | 37 |
| Retail and ecommerce | 55 | 61 |
| Software | 30 | 41 (B2B software and SaaS) |
| Media | 40 | 39 (communication and media) |
| Fintech / financial services | 46 (fintech) | 68 (financial services) |
| Insurance | Not listed | 46 |
| All industries | 42 | Not stated |
Sources: Survicate NPS benchmarks, published December 2025, and Retently NPS benchmarks, published April 2026. Industry labels differ between the two, so rows are close matches, not identical groups.
Why the gap? The datasets measure different things:
- Statistic. Survicate reports medians. Retently reports averages.
- Sample. Survicate's 2025 figures cover 599 companies and about 5.4 million responses from January to October 2025. Retently uses its own customers, with each industry needing more than 10 clients and at least 10,000 surveys.
- Year-to-year movement. Retently's own text reports insurance falling from 80 to 46 and healthcare from 53 to 37 between 2025 and 2026. A benchmark that swings that far reflects who was in the sample, not only how customers felt.
Use a benchmark to see which tier you sit in, not to set a target to the decimal. Both sources say the same thing about direction: a score above 0 is the floor, and your own trend matters more than a leaderboard. Retently puts it as "the only number that's good, is the one that's better than your previous score."
Does a good NPS depend on how you collect it?
Yes. A score from a quarterly relationship survey and a score from a survey that fires right after a support call measure different things, and they should not be compared with each other. Ask the same question, in the same way, to a comparable group, at a fixed interval.
Three rules keep your own trend clean:
- Keep the wording identical. Changing the question or the scale breaks the comparison with last quarter.
- Separate the relationship from the interaction. Report post-call scores as their own series.
- Track the sample. Scores from small samples move easily, so show the response count next to the score and avoid reading one quarter in isolation.
For the other survey metrics, see how NPS fits with CSAT and CES in our overview of call center metrics and KPIs.
How do you track NPS from phone calls?
You can ask the NPS question on the call itself and store the answer as structured data. With an AI voice agent, the steps are:
- Ask the question in the conversation. Add the 0 to 10 question to the agent's script after the caller's request is handled.
- Capture the score as a field. In Retell, Post Call Extraction runs after each call and writes results onto the call's
call_analysisobject. Add a number field for the score and a text field for the reason the caller gave. - Send it where your team works. The
call_analyzedwebhook delivers the full call, analysis included, to your endpoint, so you can write it to your CRM or survey tool. - Chart it and set an alert. The analytics dashboard can chart any custom extraction field over time. Alert rules can email you or call a webhook when the negative sentiment rate crosses a threshold you set.
Two limits to plan for. Retell does not populate custom extraction fields for calls that were not connected or had no conversation, so unanswered calls drop out of the sample. And the built-in user sentiment field is inferred from the transcript, not from tone of voice. A sentiment label is not an NPS answer, so keep the two separate.
Our step-by-step guide to tracking NPS and CSAT from call conversations walks through the build.
What should you do when your score is below the benchmark?
Treat the number as a prompt to read the comments, because the open-text reason from detractors is where the cause shows up. A practical order:
- Read the detractor reasons first. Group the last 30 days into a short list of themes.
- Check the phone queue. If calls are a main way customers reach you, find out how many are resolved the first time. Our first call resolution benchmarks show how to measure that.
- Fix one theme, then re-survey. Change one thing, wait a full survey cycle, and compare against your own previous score.
NPS cannot tell you why customers feel the way they do. It tells you whether to go and ask.
Where does Retell AI fit?
Retell AI is a voice agent platform that handles inbound and outbound calls and turns each call into structured data. If your NPS program depends on calls, the extraction fields, webhooks, and alert rules above let you collect scores during the conversation instead of in a follow-up email. Retell pricing starts from $0.07 per minute; see Retell AI pricing for the current plans.