Customer Effort Score (CES)
What customer effort score (CES) measures, the survey question and scales, how to calculate it, what a good score is, and how phone calls add effort.
Customer effort score (CES) is a customer experience metric that measures how easy or hard it was for a customer to get something done with a company, such as resolving a support issue. It is usually collected with one survey question asked right after the interaction, and the result is reported as an average score or as the share of customers who found it easy.
CES comes from research by CEB, a firm later acquired by Gartner. It was introduced in the Harvard Business Review article Stop Trying to Delight Your Customers by Matthew Dixon, Karen Freeman and Nick Toman (July 2010), which argued that reducing effort does more for loyalty than trying to delight customers. Qualtrics, citing the CEB research in the book The Effortless Experience, reports that 96% of customers with a high-effort service interaction became more disloyal, compared with 9% of those with a low-effort one.
How do you calculate customer effort score?
There are two common methods, and both start from the same survey answers.
- Average score. Add up every response and divide by the number of responses. On a 1 to 7 scale, the result is a number between 1 and 7.
- Percent who found it easy. Count the responses on the "easy" side of the scale, divide by the number of responses, and multiply by 100. On a 1 to 7 agreement scale, many teams count 5, 6 and 7. Some count only 6 and 7.
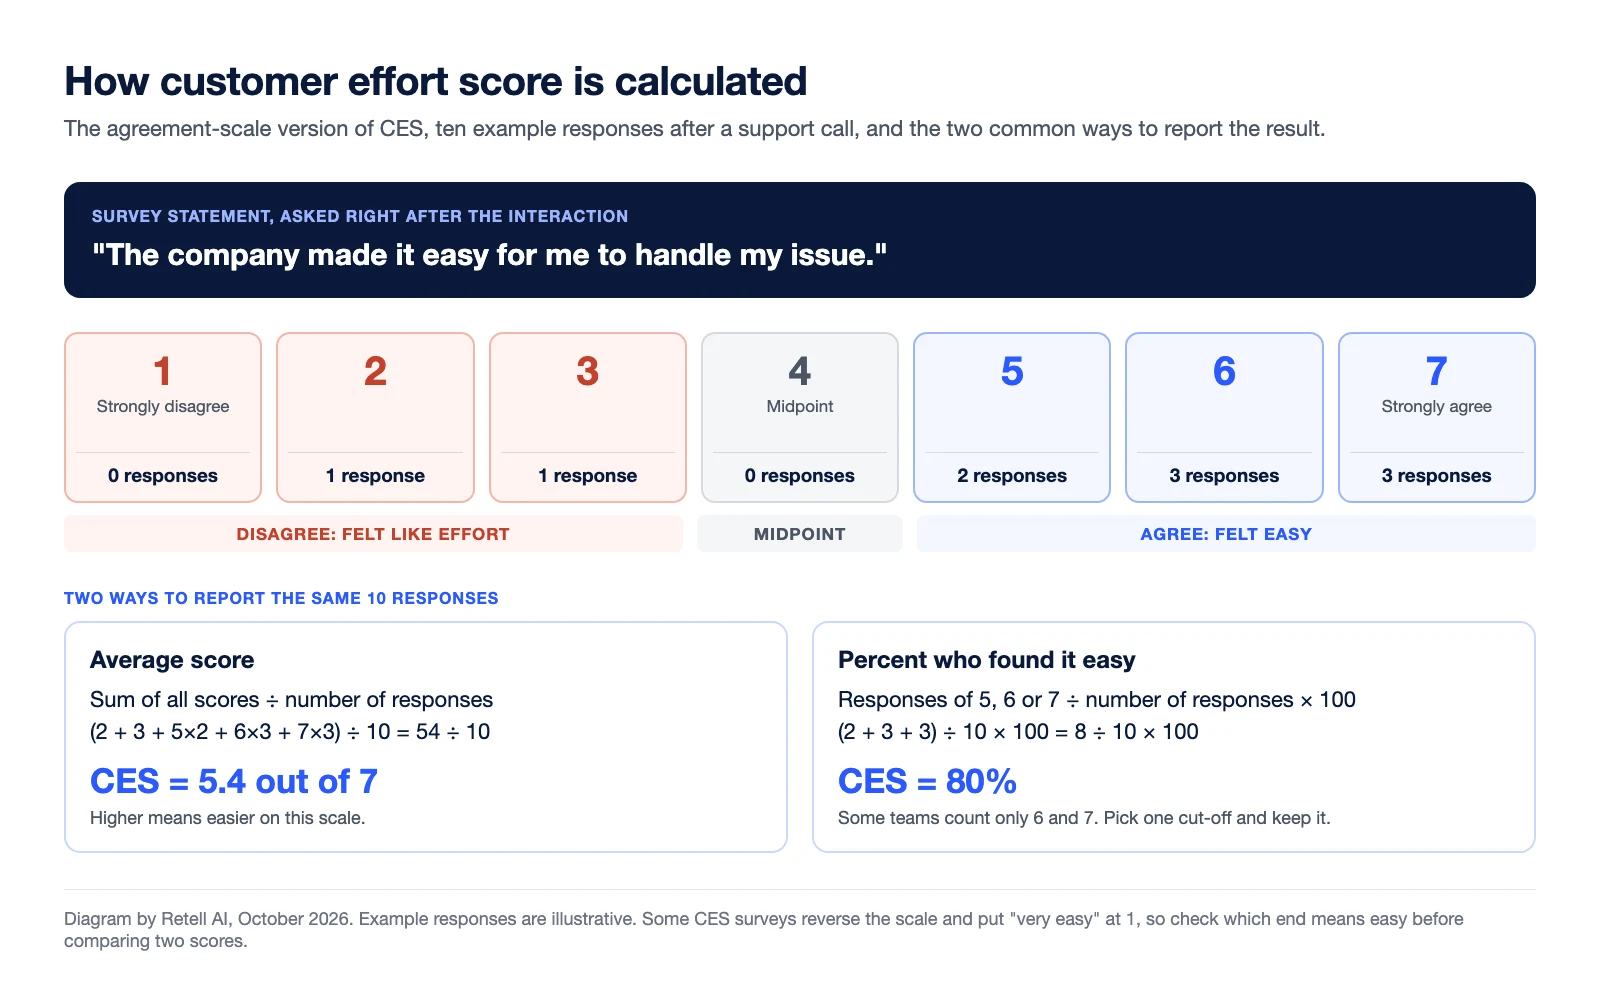
The two methods can tell different stories about the same data. In the example above, the average is 5.4 and the percent method gives 80%. Against the targets Salesforce publishes (below), the average misses its 5.5 target while the percentage meets its 80% target. Pick one method, write down the cut-off, and keep both fixed so your trend means something.
What are the CES survey question and scale options?
Most CES surveys use a version of one statement, "The company made it easy for me to handle my issue," according to Salesforce. Teams also ask the question as an ease rating. The format you choose decides which end of the scale is good.
| Format | Example wording | Scale | The easy end | Source |
|---|---|---|---|---|
| Agreement statement | "The company made it easy for me to handle my issue." | 1 to 7, strongly disagree to strongly agree | 7 | Salesforce |
| Ease rating in words | "On a scale of 'very easy' to 'very difficult', how easy was it to interact with [company name]?" | Very difficult, difficult, neutral, easy, very easy | Very easy | Qualtrics, IBM |
| Ease rating in numbers, easy first | "On a scale of 1 to 5, how easy was it to resolve your issue?" | 1 (very easy) to 5 (very difficult) | 1 | SurveyMonkey |
| Ease rating in numbers, easy last | Rate the effort of the interaction | 1 (very difficult) to 9 (very easy) | 9 | IBM |
| Two questions | Any of the above, plus "Why did you give that score?" | Scale plus open text | Depends on the scale | IBM, Salesforce |
The open-text follow-up is worth adding to any format. A score tells you that a step was hard. The reason tells you which step.
What is a good customer effort score?
There is no single benchmark, because a good CES depends on the scale and on which end of it means easy. The cut-offs vendors publish are guidance, not measured industry averages, and none of the three below cites a dataset for them.
| Source | Scale | Good score | Worth investigating |
|---|---|---|---|
| Salesforce | 1 to 5 ease scale | 4.0 or higher | Below 3.5 |
| Salesforce | 1 to 7 agreement scale | 5.5 or higher | Below 5.0 |
| Salesforce | Agreement percentage | 80% or higher | Below 70% |
| IBM | Any scale | The top 20% of your scale, such as at least 4 on a 1 to 5 scale | Not stated |
| SurveyMonkey | 1 to 5 or 1 to 7, with 1 as very easy | Under 3 | 4 to 5 needs improvement; above 5 is high effort |
Notice that SurveyMonkey calls a score under 3 good while Salesforce calls 4.0 or higher good on a five-point scale. Both are right for their own scale direction. Before you compare your CES with anyone else's, confirm the question, the scale length, and which end means easy. Then compare against your own previous months first.
How is CES different from CSAT and NPS?
CES measures how easy one interaction was. CSAT measures how satisfied the customer was with it. NPS measures the overall relationship.
| Metric | Question it answers | Typical scale | When to ask |
|---|---|---|---|
| CES | How easy was it to get this done? | 1 to 5 or 1 to 7 | Right after the interaction |
| CSAT | How satisfied are you with this interaction? | 1 to 3, 1 to 5 or 1 to 10 | Right after a purchase or support episode |
| NPS | How likely are you to recommend us? | 0 to 10 | Periodically, often quarterly or annually |
Source: Salesforce. For relationship benchmarks, see what a good NPS score is and our guide to Net Promoter Score.
What makes a phone call high effort?
The CEB research behind CES found that high-effort experiences include switching channels to get a problem resolved, repeating information, generic service, and being transferred to a different agent, according to Qualtrics. Salesforce describes the same pattern as too many steps, too many transfers, and too many repeated explanations.
On a support line, those show up as menu trees before the caller reaches help, a transfer that makes the caller explain the issue again, account details asked for twice, and a promise to call back that turns into a second call. First contact resolution is the companion metric: a call that ends unresolved usually means another contact, and another contact is more effort.
How do AI voice agents affect customer effort?
An AI voice agent can remove some of the steps that add effort, or add new ones if it is set up badly. With Retell AI, the documented features that bear on effort are:
- Context before the agent speaks. For inbound calls, the inbound call webhook lets your system set dynamic variables and other per-call context, such as details looked up from the caller's number, before the call is handled.
- Memory across calls. With contact memory, an agent can recall saved context from earlier phone calls and SMS chats with the same number and ask only for information that is missing.
- Transfers that brief the person who answers. In a warm transfer, the agent stays on the line, can wait for a real person to pick up, and can play a whisper message that only the destination hears, or introduce the caller on a three-way call.
The risk runs the other way too. If an agent cannot resolve the request and hands off with no context, the caller explains everything twice, which is the repeated-information driver the CEB research names. Track CES separately for calls the agent resolved and calls it transferred.
How do you measure CES on phone calls?
You can ask the CES question at the end of the call and store the answer as data:
- Ask before the call ends. Add the agreement statement and its 1 to 7 scale to the agent's closing, plus one open question about why.
- Capture the score as a field. In Retell, Post Call Extraction reads the transcript after the call and writes results to the call's
call_analysisobject. Add a number field for the score and a text field for the reason. - Send it to your systems. The
call_analyzedwebhook delivers the full call data, includingcall_analysis, to your endpoint. - Chart the trend. The analytics dashboard can chart any custom Post Call Extraction field over time.
Two limits to plan for. Retell does not populate custom extraction fields for calls that were not connected or had no conversation, so those calls drop out of your CES sample. And the built-in user sentiment field is inferred from the transcript, not from tone of voice, so it is not a substitute for asking the question. For a full build, see our guide to tracking NPS and CSAT from call conversations; the same steps work for CES.
Frequently asked questions about customer effort score
What does CES mean?
CES stands for customer effort score. It measures how easy it was for a customer to complete a task with a company, such as getting a support issue resolved, usually through one survey question asked right after the interaction.
Is a higher customer effort score better?
It depends on the scale. On the agreement scale, where 7 means the customer strongly agrees the company made it easy, higher is better. On ease scales that put "very easy" at 1, lower is better. Check which end means easy before you compare scores.
What is a good customer effort score?
There is no universal benchmark. Salesforce suggests aiming for 5.5 or higher on a 1 to 7 agreement scale, 4.0 or higher on a 1 to 5 ease scale, or 80% or higher as an agreement percentage. IBM suggests landing in the top 20% of whatever scale you use.
How is CES different from CSAT?
CES asks how easy an interaction was, while CSAT asks how satisfied the customer was with it. Both are asked right after an interaction. CES points to the step that made something hard, which makes it easier to act on.
When should you send a CES survey?
Send it immediately after the interaction you want to measure, such as a support call, a closed ticket, or a completed purchase, while the experience is still fresh. On a phone call, the agent can ask the question before the call ends.
Measure and lower effort on your calls with Retell AI
Retell AI is a platform for AI voice agents that answer and place calls, carry caller context into the conversation, brief a person before a warm transfer, and turn each call into structured data you can chart. Pricing starts from $0.07 per minute; see Retell AI pricing for current details.